
REVIEW ARTICLE
Prostate Cancer Detection in Screening Using Magnetic Resonance Imaging and Artificial Intelligence
Chris R. Nelson1, Jessica Ekberg2, Kent Fridell2, *
Article Information

Identifiers and Pagination:
Year: 2020Volume: 6
First Page: 1
Last Page: 11
Publisher Id: TOAIJ-6-1
DOI: 10.2174/1874061802006010001
Article History:
Received Date: 16/10/2019Revision Received Date: 22/12/2019
Acceptance Date: 16/01/2020
Electronic publication date: 20/03/2020
Collection year: 2020
open-access license: This is an open access article distributed under the terms of the Creative Commons Attribution 4.0 International Public License (CC-BY 4.0), a copy of which is available at: (https://creativecommons.org/licenses/by/4.0/legalcode). This license permits unrestricted use, distribution, and reproduction in any medium, provided the original author and source are credited.
Abstract
Background:
Prostate cancer is a leading cause of death among men who do not participate in a screening programme. MRI forms a possible alternative for prostate analysis of a higher level of sensitivity than the PSA test or biopsy. Magnetic resonance is a non-invasive method and magnetic resonance tomography produces a large amount of data. If a screening programme were implemented, a dramatic increase in radiologist workload and patient waiting time will follow. Computer Aided-Diagnose (CAD) could assist radiologists to decrease reading times and cost, and increase diagnostic effectiveness. CAD mimics radiologist and imaging guidelines to detect prostate cancer.
Aim:
The purpose of this study was to analyse and describe current research in MRI prostate examination with the aid of CAD. The aim was to determine if CAD systems form a reliable method for use in prostate screening.
Methods:
This study was conducted as a systematic literature review of current scientific articles. Selection of articles was carried out using the “Preferred Reporting Items for Systematic Reviews and for Meta-Analysis” (PRISMA). Summaries were created from reviewed articles and were then categorised into relevant data for results.
Results:
CAD has shown that its capability concerning sensitivity or specificity is higher than a radiologist. A CAD system can reach a peak sensitivity of 100% and two CAD systems showed a specificity of 100%. CAD systems are highly specialised and chiefly focus on the peripheral zone, which could mean missing cancer in the transition zone. CAD systems can segment the prostate with the same effectiveness as a radiologist.
Conclusion:
When CAD analysed clinically-significant tumours with a Gleason score greater than 6, CAD outperformed radiologists. However, their focus on the peripheral zone would require the use of more than one CAD system to analyse the entire prostate.
1. INTRODUCTION
CAD with MRT images may be used as an early detection method and as part of the screening process. Artificial intelligence can reduce image analysis time for radiologists and improve quality performance for radiology departments. This study will systematically review research articles on magnetic resonance with CAD that could be applicable to detecting prostate cancer.
2. BACKGROUND
Prostate cancer is the second most common cause of cancer death among men. However, to date there is no screening program [1]. The Prostate Specific Antigen (PSA) test can detect prostate cancer, but has a low degree of sensitivity. Magnetic Resonance Tomography (MRT) is under discussion for use in screening programmes, but this would generate a large amount of data and image slices. Computer Aided Diagnosis (CAD) could assist radiologists by analysing these images.
2.1. Data System for Reading Radiological Images
In 1966, the first attempts at computer automated diagnoses were made and failed simultaneously [2]. Automated computer diagnosis caused fear that radiologists may be replaced in 1966, 1980s and again recently with modern advancement in artificial intelligence. But Computer-Aided Diagnosis (CAD) differs from automated computer diagnosis, in that CAD assists in giving a diagnosis and the automated version gives the diagnosis [2].
Data systems for reading medical images have been growing and developing since the 1980s. CAD is a machine-learning service built on algorithms to help in diagnosis. Fundamentally, it trains a computer system to read images. First doctors look at images and they give a diagnosis. Then a computer attempts to analyse the images with the aid of algorithms and gives the precisely the same result as the doctors [3]. The data system marks suspicious forms or pathologies in the image. These data systems have a plethora of different names such as CADs, machine learning, cognitive learning, artificial intelligence, deep learning and many more. These systems are usually designed with a specific area of interest in the human body such as lung CAD or mammography CAD. These specific and specialised CADs may use special algorithms to detect lung nodules in case of overlapping in chest x-ray [2].
2.2. Machine Learning Versus Artificial Intelligence and CAD
Artificial intelligence-based computer systems consist of implanted rules [4] which disallow or exclude certain criteria but do not enable free learning. Machine learning, or deep learning data systems do not have these implanted stop rules [5] which are important as they allow these systems to learn on their own. Deep learning systems can learn on their own and do not always require large fodder data to analyse new data properly [6].
These different data systems become more accurate with larger image databases. However, in order to determine if artificial intelligence is working properly, a large influx of new images must be scanned. These data systems must perform at a very high level in order to be acceptable [2].
The hierarchy of CAD can be confusing and, in order not to baffle the readers of this study, the following terms will be referred by the collective names of CAD: artificial intelligence, deep learning and CAD.
2.3. Radiologists’ Imaging Guidelines
(This section on radiologists’ imaging guidelines is important because it shows what CAD must mimic and do if it is to be effective. This section supports other information in later sections.)
Image guidelines for prostate cancer are found and reported in the “Prostate Imaging Reporting and Data System” (PI-RADS). These guidelines are revised and published jointly by the American College of Radiology and the European Society of Urogenital Radiology. This data system contains various prostate maps that aid in the diagnosis and analysis of the prostate. One map type is the prostate sector map that divides the prostate into thirty-six sectors. Other maps also show common areas for cancer and their different types. The system contains pathological images for reference. PI-RADS contains other data such as standardised reporting, biopsy scoring/Gleason’s score, MRI data and images, classification, staging and diagnostic performance for detection [7, 8]. Radiologists can use the PI-RADS data system as an aid on how to analyse images and judge image pathology in order to give their diagnoses.
The primary use of PI-RADS with MRI is to evaluate the extent of prostate cancer and whether it has spread throughout the prostate. Radiologists use standardised reporting for MRI prostate scans which segments the seminal vesicles, plus the prostate into three main regions (apex, mid, base) and nine subregions. Radiologists examine the prostate using four different scanning images types. Any areas of interest are noted on a report and the PI-RADS scores for those four image types [7, 8]. It is recommended that they have PI-RADS prostate maps on a screen beside patient images for diagnostic reference.
2.4. Radiological Analysis
The reading process starts from the anterior to the posterior portion of axial image. The radiologist reads from a left superior to right superior area of the image then reads downward inferior as they scroll through the images. This process takes a long time due to the number of images and a series of MRT images (Fig. 1) and the inhomogeneous texture of the prostate [8].
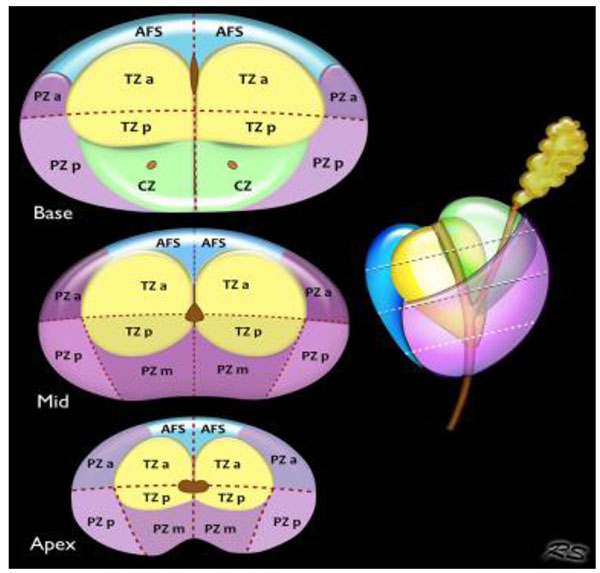 |
Fig. (1). Section map dividing the prostate into different sectors and zones. Image from pi-rads version 2. |
2.5. Pathology and Cancer Detection
Prostate cancer is divided into different stages which describe the severity of cancer. Prioritising of patients depends on the availability of modalities, their cost, their effectiveness and how serious the patient’s situation is [9, 10].
To help diagnose prostate cancer, health services should suggest a specific blood test called the Prostate-Specific Antigen (PSA) to men between 50-70 years of age. PSA tests can help decrease the risk of death, but the test is not one-hundred percent reliable and can lead to overdiagnosis. Patients with a positive PSAs are often followed up with ultrasound examination and biopsy to the prostate or lymph nodes in the pelvic region [10]. Ultrasound guided transrectal biopsy of the prostate has an approximate sensitivity of 48% and a specificity of 96% [11]. Negative side effects from a diagnostic biopsy and treatment of the prostate can include loss of sexual function, urine leakage and rectal issues [10, 11] which may be due to cutting through the rectal intestine to access the prostate.
MRT prostate examinations are non-invasive and give an exact volume of the prostate and aid in segmenting. MRI features such as apparent diffusion coefficients and gives an indication if the tumour detected is cancerous or not [12]. It is still unknown how many men have prostate cancer without symptoms or at which age cancer becomes prominent [10]. Only with routine screening more accurate data can be collected in order to understand prostate cancer better.
2.6. Effects of an Active Screening Programme
An active screening programme, aimed at identifying potentially curable cancer, may be considered effective if, on average, it increases life expectancy of screened prostate cancer patients by 1 year or more. Cost effectiveness is vital, total cost estimate in 2004 for digital rectal examination with PSA test every three years would cost an extra SEK 244 million annually. Effectiveness, time, materials, cost and workload must be considered when implementing a screening programme [1]. CAD could assist radiologists by increasing effectiveness, decreasing workload, decreasing costs and saving time when analysing images [2, 5]. Benefits of screening would be early detection of prostate cancer, better understanding of the disease, increased life expectancy and improved well-being of the patients.
3. AIM
The purpose of this study is to analyse and describe current research in MRI prostate examination with the aid of CAD. The aim is to determine if CAD systems provide a viable and reliable method together with MRI to assist radiologists and even become part of the screening process.
4. MATERIALS AND METHODS
4.1. Eligibility Criteria and Search
Methodology used involved the systematic search and collection of articles from medical databases based on key search terms. A systematic compilation of earlier scientific studies and articles covering the subjects of “MRI”, “prostate cancer” and “CAD” or “artificial intelligence”. Only original articles were selected and articles older than 2014 were classified as old research [13]. Systematic compilation was performed using the “Preferred Reporting Items for Systematic Reviews and for Meta-Analysis” (PRISMA) system for reporting systematic research. Inclusion criteria were the most up to date CAD system or artificial intelligence in order to see if they were fully developed and of use clinically. Exclusion criteria were articles covering combination examinations with CAD, such as PET/CT or MRT. Studies of biopsy led by artificial intelligence were excluded but results from prostate biopsies with a focus in MRI prostate examinations that used artificial intelligence or CAD were used. These inclusion criteria were selected to improve the quality of the article. A series of filters were used to help narrow down the articles to review: peer reviewed, human studies and articles published February 2014-2019 [14-16].
4.2. Implementation and Information Sources
This is a literature study including a qualitative systematic review of original scientific articles with its focus on CAD systems in the use of MRT prostate exams from medical databases [17-19]. Almost all the information was searched from medical databases such as PubMed, Web of Science, CINAHL. A PRISMA table of search methods for databases and search words was created Table 1. Multiple searches were used with multiple search terms and filters in order to collect the most relevant, up-to-date articles on a continuous basis. The final search was carried out in PubMed and used as this was a better source of medicine-based articles. The final day for searching and all data collection was 25 March 2019.
4.3. Search Methods
A final search of terms in the Pubmed medical database. The main search terms were “MRI, “prostate cancer” and one of the following two terms: “CAD” or “artificial intelligence”. The search results were then filtered based upon free access, year, human studies, original article and peer review. Results were saved and sent to a common folder in the Endnote digital software. Articles were checked for duplicates and any duplicates were removed. The search terms “MRI” and “prostate cancer” and “CAD” yielded 22 articles, while “MRI” and “prostate cancer” and “artificial intelligence” yielded 67 articles.
4.4. Study Selection
This study uses a qualitative analysis method for comparison of the original articles in the 2014-2019 timeframe [19]. A total of 89 articles were first reviewed and then filtered more thoroughly. A final compliment and reiteration of 39 original articles for results and 12 separate articles for use in the discussion were carried out.
Following the system for preferred reporting items for systematic reviews and meta-analyses “PRISMA”, a systematic screening method was implemented for sorting and listing reference articles. First a quick selection of articles based on their titles. If it was unclear whether a title was beneficial to this study, a quick review of its abstract was performed. Titles and abstracts that were assessed as fulfilling exclusion criteria were removed from further review. Articles which were not relevant or titles that had no relevance were also excluded. A second stage was implemented in which the remaining articles were reviewed. This stage was followed by the analysis of all remaining articles. Any abstract or article that was not relevant or content that focused on exclusion parameters was removed at that point. In the final review process, the quality of content in the remaining articles was assessed, a written summary was made indicating categories of content within each article. Quality assessment was performed using a quality protocol for studies [20]. The entire process is iterated in a PRISMA flow diagram Table 1. Articles that met inclusion criteria focused on the radiological processing by artificial intelligence/CAD working with MRIs of prostates. They also included data about their learning, training and performance with radiologists or in comparison to another CAD system. The focus was on their more basic medical applications in this study and not on high-level technical information.
4.5. Data Collection
Summaries were created of a total of 39, fully-reviewed articles from PubMed from which the relevant data was obtained. Data was organised into different categories. Organised category data from all studies was paired together and then analysed for use in results. Finally, organised, paired data was summarised and given a title in the results.
4.6. Analysis and Synthesis of Results
After all the selected articles were summarised, their results were obtained. The summaries were analysed for keywords and main themes which were then highlighted. These main themes were organised into a categorised group content, based upon their common area of use. Shared themes were extrapolated from these articles including: CAD sensitivity and specificity versus radiologists, CAD pathological detection sensitivity and specificity-PAD versus CAD, segmentation of the prostate-manual method versus CAD, CAD-assisted reading times, error correction with CAD, radiological image interpretation by CAD and radiologist, gold standards PSA and biopsy versus CAD detection with MRT, MRI CAD training and testing. All relevant article data pertaining to the main theme was placed under its corresponding theme title.
4.7. Research Ethics
Only original scientific articles on examination of humans are cited in this study, excluding review articles [13]. All information is reiterated in the authors’ own words from their own understanding of the articles read. No third parties were used to write or do the work of this study. Scientific articles older than five years only appear in the background as they pertain to the history of the subject and previous research. Only scientific articles within the last five years are used in the study so as to include only the most modern, up-to-date information.
5. RESULTS
The results are based on 39 different scientific, peer-reviewed, original articles that focus on CAD and artificial intelligence in MRI prostate scans. Various researchers tested modified version of previous artificial intelligence programs, tested newly-developed artificial intelligence/CAD systems or tested the accuracy of CAD against seasoned radiologists. Results will address sensitivity and specificity, segmentation, image interpretation, error correction, time aspects, training and testing of artificial intelligence systems.
5.1. CAD Sensitivity and Specificity Versus Radiologists
The average sensitivity for cancer detection for all relevant studies was 86.8% [14-31]. For all studies, peak sensitivity was 98% and lowest was 46.8% (25, 30). The average specificity of CAD was 79.8% [14-31]. Peak specificity for all studies with CAD was 100% and lowest 57.1% [21, 27, 31]. CAD can reach a 100% sensitivity in distinguishing indolent from aggressive cancer tumours [22]. CAD showed higher sensitivity of tumour detection when tumours were clinically significant, with a Gleason score greater than 6 [18, 24].
The average sensitivity of a seasoned radiologist is 94% and specificity 85.5% [32, 33]. The average first year radiologist had a sensitivity of 81% and specificity of 83% [32]. In every study where radiologists used CAD in tumour detection, they showed increased sensitivity [14, 15, 27, 31] Table 2
5.2. CAD Pathological Detection, Sensitivity and Specificity - PAD Versus CAD
A combination of digitalised pathology, multi-parametric MRT and CAD creates probability maps with specific characteristic histology of prostate cancer focal position. Pathologists segmented the prostate on MRT images of patients before proctectomy and created individual 3D models to aid the identification of pathology within the prostate. These prostate models are used when manually segmenting and slicing the prostate. In this process the prostate is scored with Gleason or Likert score. Prostates are dyed at the time of surgical extraction to identify clinically-significant finds and to divide the prostate into different regions. These prostates were then sliced to 5 micro-meters and digitally scanned and added to MRI data space to create prediction maps for CAD [20, 33-35].
Regions of decreased lumen and higher density of epithelium indicated high grade tumours shown in radio-pathologic maps with matching pathologic annotation. Because algorithms could detect cell density voxel-wise, densities of different tissues can be quantitively estimated [18, 36].
5.3. Segmentation of Prostate-Manual Method Versus CAD
Accuracy of manual segmentation can vary due to image quality and how the observer interprets the image. There are multiple and different approaches to the analysis and segmentation of the prostate. A volume-based approach is where one voxel is compared with other voxels around it and similar voxels were clustered together. CAD algorithms can generate a map of the prostate from this voxel cluster data [23, 37, 38]. The prostate can be segmented well in 3D slices from a 3D generated MRI, however this method is unpopular because it takes longer than normal manual segmentation [37].
Another approach is axial registration, one axial image is registered with the next and fused together until the prostate is segmented [38, 39]. However, this process causes overlapping and decreases specificity but does possess increased repeatability. Axial segmentation uses axial images and then co-registration images to detect the entire prostate. CAD combines regions together and separates different parts of prostate. Images are smoothed around the edges and the background was blackened out in order to focus on analysing the prostate only. When CAD combined structural data, it greatly enhanced segmentation. Accuracy of this type of segmentation yielded a DICE coefficient of 90.77% from combined data [32]. The average DICE score for all segmentation data is 90.05%.
5.4. CAD-Assisted Reading Times
The average prostate reading timings improved with CAD for radiologists. In one study timings improved from 4.6 minutes unassisted to 3.4 minutes with the system [26]. Other studies showed a 50% increase in reading times [18].
5.4.1. Segmentation Reading Times
Manual segmentation can be time consuming, tedious and subjective depending upon the radiologist [20]. The fastest time for an experienced radiologist to segment the prostate in 30 seconds and a radiologist technician 1 minute [32]. Average CAD segmentation time is 26 seconds and the fastest time is 4 seconds from data [40-42].
5.5. Error Correction with CAD
MRI with CAD can avoid unnecessary surgeries. In one study, CAD corrected errors where 21 of 44 tumours showed a false positive with Likert score of 3. And 29 of 82 showed false negative findings with a Likert score of 4 in the same study [16]. CAD can act as a second reader verifying findings and reducing false findings [16, 31]. This aids radiologists and reduces diagnostic oversight [21].
5.6. Radiological Image Interpretation of CAD
CAD increases the security of medical image assessment among radiologists [14]. CAD also increase the sensitivity and specificity of radiologists after viewing CAD-generated probability maps [20]. CAD increases the sensitivity of all its readers. CAD systems can colour code voxels based on the probability of malignant cancer. With over 60% malignancy per voxel, the CAD algorithm will colour voxels red to alert the reader of significant cancer suspicions [23, 24]. CAD systems can give other, visually-represented findings before, during or after the reader has analysed images. Such as showing low-signal intensities to differentiate between benign, malignant or image artefacts [24, 32, 43-45]. CAD systems can differentiate tumours with very high specificity, up to 100%, which means CAD can give grading analyses of tumours [27]. High signal intensity artefacts limit the detection of tumours in the peripheral zone for CAD systems but have little or no effect on the observer [46].

|
| Study/ Author | Zone/ Area of Interest | Sensitivity | Specificity | Gleason Score>6 Sensitivity | Gleason Score>6 Specificity | DICE Similarity Coefficient/ Accuracy |
| Greer et al. | PZ & TZ | 86.3% | 57.1% | - | - | - |
| Dinh et al. | PZ | 95.0% | - | - | - | - |
| Thon et al. | - | 46.8% | 75.4% | - | - | - |
| Giannini V. et al. 2017 | - | 94.3 % | 87.6% | 91.3% | 87.6% | - |
| Gao G. et al. 2017 Rida I. et al. 2017 |
PZ & TZ | 81.8% 83.3% |
94.5% 100% |
- - |
- - |
92.3% - |
| Giannini V. et al. 2015 | PZ | 84.0% | 86.0% | - | - | - |
| Citak-Er F, et al. 2014 | - | 86.5% | 87.9% | - | - | - |
| To, MNN, et al. 2018 | - | - | - | - | - | 95.1% |
| Tian et al. 2018 | - | - | - | - | - | 85.3% |
| Li J, et al. 2018 Dataset 1 | PZ, CG | 95.2% | 100% | - | - | 97.6% |
| Li J, et al. 2018 Dataset 2 | PZ, CG | 90.3% | 92.2% | - | - | 89.7% |
| Iyama. Dataset 1 | PZ, TZ | 90.0% | 60-90% ¤ | - | - | - |
| Iyama. Dataset 2 | PZ, TZ | 82.0% | 95.3% | - | - | - |
| Zhu Y, et al. 2017 | - | 91.5% | 88.5% | - | - | - |
| Tian Z. 2017 Merisaari (SVM) |
- - |
- 93.0% |
- 91.7% |
- - |
- - |
87.2% - |
| Merisaari (LR) | - | 86.7% | 77.2% | - | - | - |
| Guo Y. et al. 2014 | - | - | - | - | - | 90.1% |
| Stember JN, et al. 2014 | - | 84.4% | 78.1% | - | - | - |
5.6.1. Tumour Differences in Prostate Zones
Peripheral zone tumours appear to be round on MRI and are easier to detect. Tumours in the transition zone are heterogenous and very hypointense. Normal MRI visualises transition zone tumours best with the aid of apparent diffusion coefficient [24]. Transition zone tumours are very difficult to distinguish from other tissues. A study in 2017 showed 80% of small tumours in the transition zone had a Gleason score greater than 6 [47]. Zone specific CAD could assist detection of small tumours in the transition zone.
5.6.2. Radiologist’s Interpretation of Images
There is great variability among radiologists’ performance [16, 24]. Interpretation of of images by radiologists is very subjective based upon expertise and what the observers see [23]. Radiologist expertise is based on education, experience in medical imaging, personal preferences and medical culture level. Medical culture level is how much a radiologist interacts with other radiologists and specialists [28]. These factors can limit repitition and accuracy of radiologist assessments [28] repeatably. These factors can cause strong inconsistencies between radiologist’s reading of images. An example of this is the radiologist distinguishing cancer in the transition zone [23].
5.7. PSA and Biopsy Versus CAD Detection with MRT
For prostate cancer detection there is the Prostate Specific Antigen (PSA) test, followed by ultrasound biopsy of the prostate. PSA is the most popular method for prostate cancer detection but has low specificity and a high rate of false positives [17, 48]. After a positive PSA the average waiting period for biopsy is a month [16]. It is not uncommon that biopsy needles can be missed or harvest the wrong cells. Usually 5-7 samples are taken to avoid a return visit. It is not uncommon to have to return for another biopsy due to a negative biopsy with positive PSA [27, 48]. Urologists usually target the peripheral zone where 70% of cancerous tumours are present. But half of the 30% of cancers within the transition zone are very aggressive and often missed [48]. Due to these factors, ultrasound biopsy shows a high false negative rate [23].
CAD with MRT can limit or avoid unnecessary biopsies by eliminating false positives or negatives and targeting the entire prostate [16]. CAD systems are primarily trained for the peripheral zone, but certain CAD systems focus on the transition zone or both zones [20, 24, 26, 48].
5.8. MRI CAD Training and Testing
Training for CAD systems to function without input and testing their performance against datasets is popular. One common technique during the training phase is that the radiologist encircles the regions of interest on images. While this is positive training for CADfor the radiologist, it can create learned bias from a subjective diagnostic approach [41, 49-51]. If the CAD system only mimics the radiologist-directed regions of interest, it is quite possible to miss other areas. To avoid this problem, many modern CAD systems are developed to be multi-functional and focus on areas of interest, signal intensities, feature extractions, pattern mining and other parameters.
5.8.1. Errors Using Signal Intensity-based CAD Systems
During MRT scans, tissue does not retain the same numeric signal intensity value. Signal intensities change because of poor radio frequency coils. Also because of MRI protocol, body region and excessive heat build-up [27] except for the diffusion-weighted images and their derivative are the apparent diffusion coefficient. These factors are important because certain CAD systems are based on signal intensities only and lack standardised intensity. They do not retain the same data value, nor do they maintain the same sensitivity despite retaining all parameters and running the same scan a second time [27, 41].
5.8.2. Specific Extracted Features
A CAD system can extract up to 300 hundred specific features in prostate MRT images, many of which the observer cannot see. CAD uses these to interpret images and differentiate tissue [20, 23, 26, 30, 50, 51]. A type of specific extraction can be pattern-mined in which the CAD analyses thousands of images to match a specific pattern in the current image being read and give probability feedback of what it could be [26].
6. DISCUSSION
This study aimed to see how artificial intelligence/CAD systems can assist radiology in MRT prostate examinations.
Use of CAD systems for MRI examinations may improve the sensitivity of radiologists. Radiological assessments of MRI prostate examinations are subjective and vary between radiologists. CAD systems can increase their effectiveness, and save time in analysing images. CAD systems have different classification zones focused on peripheral, transitional and the central gland of the prostate. Many CAD systems focus only on peripheral zone and do not account for biological differences caused by tumours in the transition zone [50]. Certain types of CAD systems that use signal intensities as a base measurement to differentiate between tissues show data that varies despite all parameters remaining the same and re-running the exact same examination. This variation is due to failed series sources which are affected by heat or some other variation in MRT parameters. CAD systems have the potential to learning on a continuous basis and also the ability to unlearn unimportant information itself such as background noise.
6.1. Pathological Scores give CAD better Sensitivity and Specificity
The ability of CAD to quantify and classify prostate cancer is imperative when analysing images [52]. In one study of 364 patient CADs showed 100% sensitivity in differentiating prostate cancer aggressiveness from indolence. This differentiating capability was due to preregistering tumour data in different image planes combined with the Gleason scores received from targeted ultrasound biopsies [15, 53, 54]. Two different studies produced 100% specificity [20, 24]. The first, a CAD system, used two-dimensional diffusion weighted images based on geometric deformation to segment the prostate. Followed by describing the prostate in terms of mathematical labels and then classifying it [18].
In the second study, a CAD system focussed on the central gland of the prostate. A radiologist marked 152 cancerous regions of interest in the central gland of 136 patients, which was confirmed by pathology after ultrasound-guided biopsies and given Gleason scores [22, 54]. The CAD system only evaluated these cancerous regions and then different parametric maps for programming. After which the artificial intelligence system classified the prostate in terms of Gleason scores. The artificial intelligence was trained on two evenly split datasets based on 14 image features. This study’s CAD showed a sensitivity of 95.2% and a specificity of 100% in Dataset 1. Dataset 2 gave a sensitivity of 90.3% and a specificity 92.2% [22]. By focusing the learning artificial intelligence and with the aid of histopathological data, artificial intelligence produced a high classification rate of prostate cancer. And showed similar classification levels to experienced radiologists [55].
CAD systems are more sensitive to variations in images, they could be optimal for treatment and distinguishing between clinically-significant cancer or benign prostate hyperplasia [56]. Even with good results from improved multi-parametric MRIs, approximately 10-20% of cancers are missed. Benign specific features can mimic cancer and make detection difficult [56]. CAD can assist by quantifying data from a different perspective and being able to distinguish benign features from prostate cancer.
6.1.1. Wide Variation in CAD Systems
A CAD study in 2014 of 40 different CAD systems showed the following sensitivity and specificity. The results showed a wide variation in sensitivity between 74-100% and specificity of between 43-93% [53]. Each CAD system did not perform at the same rate due to the considerable difference in type of system, classifiers, progressive advancements, algorithms and learning parameter of these systems. Of the 39 articles analysed, 17 reported sensitivity of 46.8-98.0% and specificity of 57.1-100%. The sensitivity of 46.8% and 57.1% specificity are single outliers which should not be considered especially relevant. The clear majority showed sensitivity 82-98% and specificity 70-100%. The data gathered would suggest a progressive improvement of CAD and artificial intelligence.
6.1.2. Pathological Scores Improve CAD Segmentation
The best current CAD segmentation methods combine histological and pathological findings with multi-parametric MRIs [57]. This allows these systems to analyse specific textures and features within the prostate to segment them into different zones. A selected few CAD systems have the capability of segmenting tumours, which could be helpful with patient therapy.
6.2. PSA and Biopsies Less Sensitive than CAD with MRI
Pre-treatment and preoperative planning often utilise MRT to analyse the prostate. MRT is not used as a grading or screening method for prostate cancer [58]. But could MRT with CAD algorithms outperform PSA and ultrasound? PSA testing has a sensitivity of 77% and a high false negative rate [56, 58]. PSA is beneficial because it is fast and cheap [57]. Relying upon PSA only as the first line of defence could cause a delay in cancer detection which could mean years before first detection. Classifying prostate cancer can also be a difficult task. The accuracy of detection for prostate cancer using standard ultrasound-guided biopsy can be as low as 40% [51]. And approximately 30% of patients must undergo repeated biopsies or prostate removal [56]. The lowest reported sensitivity of CAD/artificial intelligence is 43% with the clear majority being between 82-100%.
6.3. CAD Prostate Segmentation Capabilities
Manual segmentation is both tedious and time consuming due to the number of images requiring segmentation. It is also difficult to distinguish between different tissues due to the inhomogeneous nature of the prostate. The prostate size, shape and outer surface appearance can vary [7, 59]. These aspects make it more difficult to make classifications and can increase the risk of more false findings. Incorrect findings lead to unnecessary measures or lack of proper treatment. Multiple studies have shown that CAD algorithms are just as capable or superior to radiologists [60-62]. Using CAD in a clinical setting has the potential to save time for radiologists as they could begin by reading already-segmented images. CAD can even produce a segmentation analysis over time from extrapolations which shows the probabilities of how prostate tumours and the prostate could progress over time.
6.4. CAD-Assisted Reading Times - Discussion
The accuracy and speed of these CAD/AI systems are dependent upon how their algorithms register data and how the system has been trained to learn effect calculation times [59]. One example is a multi-atlas algorithm that segments the prostate in an axial direction which requires data labels for learning each voxel. The process causes overlapping of 1-3 slices, which requires the system to take longer in calculating data from these slices and re-verifying that the data is correct [57]. It takes approximately 30 milliseconds for algorithms to analyse a new image [63]. Due to the great extent of variabilities in algorithms, segmentation times and reading times vary from as fast as 4 seconds to 4 minutes [40-42, 60].
6.5. Limitations of CAD use with MRI Prostate Examinations
CAD is capable of many good things but does not do everything perfectly. There are multiple factors why radiologists or clinics may not use CAD for MRI prostate examination. One limitation is too much variation due to the myriad of different systems which focus on different aspects of the prostate. Many of which are partial carbon copies of parts of earlier systems which affect how they are built and trained to learn information. These are some of the factors that contribute to the wide variations in the accuracy and effectiveness of CAD systems. A more standardised CAD system is necessary to scan the entire prostate. One study that tested a commercially-ready product found that it performed well below the performance of a radiologist. That same study did not mention the expected sensitively and specificity, nor did it mention whether the CAD system specialised in one area of the prostate. There was no mention in any study of how much these different CAD systems cost. Some CAD systems have limited training data sets due to personal data security laws or too unattainable training data. While they can perform well with a small training set, they can perform more weakly in larger population. No studies were found on the cost effectiveness of CAD systems.
CONCLUSION
By analysing current peer-reviewed articles of MRI prostate cancer images, analysis by CAD systems was evaluated. CAD systems have shown progressive advancement in their effectiveness in analysing the prostate.
When analysing clinically-significant cancers with a Gleason score of greater than 6, CAD systems outperformed radiologists. Different CAD systems can reach a peak sensitivity of 100% and others with a peak specificity of 100%. CAD systems are just as capable of segmenting the prostate as radiologists. This can be carried out in a similar or faster reading time than radiologists. CAD systems have shown they can achieve higher sensitivities and specificities than currently-recognised gold standards.
CAD systems are often specialised in the peripheral zone, this may be a weakness as 30% of cancers in the transitional zone could be missed. This would mean the use of multiple CAD systems to analyse the entire prostate efficiently. Another weakness is a considerable difference in the variation of CAD system sensitivity and specificity.
This study recommends that CAD results show that they could form a good compliment to radiologists and can assist them in their tasks. They can reduce reading times, segment the prostate, colour code the prostate and mark areas of interest.
CONSENT FOR PUBLICATION
Not applicable.
FUNDING
None.
CONFLICT OF INTEREST
The authors declare no conflict of interest, financial or otherwise.
ACKNOWLEDGEMENTS
Declared none.
REFERENCES
| [1] | Sennfält K, Sandblom G, Carlsson P, Varenhorst E. Cost and effects of prostate cancer screening in Sweden: A 15 year follow up of a randomised trial Scand J Urol Nephrol 2004; 38(4): 291-8. |
| [2] | Doi K. Computer-aided diagnosis in medical imaging: Historical review, current status and future potential. Comput Med Imaging Graph 2007; 31(4-5): 198-211. |
| [3] | Lao G, Stone BL, Nkoy FL. Automating construction of machine learning models with clinical big data: Proposal rationale and methods. JMIR Res Protoc 2017; 6(8): e175. |
| [4] | Lee G, Romo Bucheli D E, Madabhushi A. Adaptive dimensionality reduction with semi-supervision (address): Classifying multi-attribute biomedical data. PloS One 2016; 11(7): e0159088. |
| [5] | Gaur S, Lay N, Harmon SA, et al. Author information Can computer-aided diagnosis assist in the identification of the prostate cancer on prostate MRI? A multi-center, multi-reader investigation. Oncotarget 2018; 9(73): 33804-17. |
| [6] | Rampun A, Tiddeman B, Zwiggelaar R, Malcom P. Computer aided diagnosis of prostate cancer: A texton based approach. Med Phys 2016; 43(10): 5412-25. |
| [7] | Purysko AS, Rosenkrantz AB, Barentsz JO, et al. PI-RADS version 2: A pictorial update (RNSA) Radiographics 2016; 36(5): 1354-72. |
| [8] | Röthké M, Blondin D, Schlemmer HP. Franiel T. PIRADS classification: Structured reporting for MRI of the prostate. Magnetom Flash 2013; 4: 30-8. |
| [9] | Socialstyrelsens nationella riktlinjer för bröstcancervård. Stockholm: Socialstyrelsen 2013. Available from: http://www.socialstyrelsen.se/Site CollectionDocuments/nr-cancer-presentation-brostcancer.pptx |
| [10] | Socialstyrelsens nationella riktlinjer för bröst-, prostata-, tjocktarms- och ändtarmscancervård. Stockholm: Socialstyrelsen 2014. Available from: https://www.socialstyrelsen.se/publikationer2014/2014-4-2 |
| [11] | Brown LC, Ahmed HU, Faria R, et al. Multiparametric MRI to improve detection of prostate cancer compared with transrectal ultrasound-guided prostate biopsy alone: The PROMIS study. Health Technol Assess 2018; 22(39): 1-176. |
| [12] | Pepe P, D’Úrso D, Garufi A, et al. Multiparametric MRI apparent diffusion coefficient (ADC) accuracy in diagnosing clinically significant prostate cancer. In Vivo 2017; 31(3): 415-8. |
| [13] | George A. Research ethics. Medicine (Baltimore) 2016; 44(10): 615-8. |
| [14] | Greer MD, Lay N, Shih JH, et al. Computer-aided diagnosis prior to conventional interpretation of prostate mpMRI: An international multi-reader study. Eur Radiol 2018; 28(10): 4407-17. |
| [15] | Le MH, Chen J, Wang L, et al. Automated diagnosis of prostate cancer in multi-parametric MRI based on multimodal convolutional neural networks. Phys Med Biol 2017; 62(16): 6497-514. |
| [16] | Dinh AH, Melodelima C, Souchon R, et al. Characterisation of prostate cancer with gleason score of at least 7 by using quantitative multiparametric mr imaging: Validation of a computer-aided diagnosis system in patients referred for prostate biopsy. Radiology 2018; 287(2): 525-33. |
| [17] | Thon A, Teichgräber U, Tennstedt-Schenk C, et al. Computer aided detection in prostate cancer diagnostics: A promising alternative to biopsy? A retrospective study from 104 lesions with histological ground truth. PLoS One 2017; 12(10)e0185995 |
| [18] | Giannini V, Mazzetti S, Armando E, et al. Multiparametric magnetic resonance imaging of the prostate with computer-aided detection: experienced observer performance study. Eur Radiol 2017; 27(10): 4200-8. |
| [19] | Gao G, Wang C, Zhang X, et al. Quantitative analysis of diffusion-weighted magnetic resonance images: Differentiation between prostate cancer and normal tissue based on a computer-aided diagnosis system. Sci China Life Sci 2017; 60(1): 37-43. |
| [20] | Reda I, Shalaby A, Elmogy M, et al. A comprehensive non-invasive framework for diagnosing prostate cancer. Comput Biol Med 2017; 81: 148-58. |
| [21] | Giannini V, Mazzetti S, Vignati A, et al. A fully automatic computer aided diagnosis system for peripheral zone prostate cancer detection using multi-parametric magnetic resonance imaging. Comput Med Imaging Graph 2015; 46(Pt 2): 219-26. |
| [22] | Citak-Er F, Vural M, Acar O, Esen T, Onay A, Ozturk-Isik E. Final Gleason score prediction using discriminant analysis and support vector machine based on preoperative multiparametric MR imaging of prostate cancer at 3T. BioMed Res Int 2014; 2014690787 |
| [23] | Tian Z, Liu L, Zhang Z, Xue J, Fei B. A supervoxel-based segmentation method for prostate MR images. Med Phys 2017; 44(2): 558-69. |
| [24] | Li J, Weng Z, Xu H, et al. Support Vector Machines (SVM) classification of prostate cancer Gleason score in central gland using multiparametric magnetic resonance images: A cross-validated study. Eur J Radiol 2018; 98: 61-7. |
| [25] | Leng E, Spilseth B, Zhang L, Jin J, Koopmeiners JS, Metzger GJ. Development of a measure for evaluating lesion-wise performance of CAD algorithms in the context of mpMRI detection of prostate cancer. Med Phys 2018; 45(5): 2076-88. |
| [26] | Iyama Y, Nakaura T, Katahira K, et al. Development and validation of a logistic regression model to distinguish transition zone cancers from benign prostatic hyperplasia on multi-parametric prostate MRI. Eur Radiol 2017; 27(9): 3600-8. |
| [27] | Zhu Y, Wang L, Liu M, et al. MRI-based prostate cancer detection with high-level representation and hierarchical classification. Med Phys 2017; 44(3): 1028-39. |
| [28] | Merisaari H, Movahedi P, Perez IM, et al. Fitting methods for intravoxel incoherent motion imaging of prostate cancer on region of interest level: Repeatability and gleason score prediction. Magn Reson Med 2017; 77(3): 1249-64. |
| [29] | Stember JN, Deng FM, Taneja SS, Rosenkrantz AB. Pilot study of a novel tool for input-free automated identification of transition zone prostate tumors using T2- and diffusion-weighted signal and textural features. J Magn Reson Imaging 2014; 40(2): 301-5. |
| [30] | Litjens GJ, Barentsz JO, Karssemeijer N, Huisman HJ. Clinical evaluation of a computer-aided diagnosis system for determining cancer aggressiveness in prostate MRI. Eur Radiol 2015; 25(11): 3187-99. |
| [31] | Zhang YD, Wang J, Wu CJ, et al. An imaging-based approach predicts clinical outcomes in prostate cancer through a novel support vector machine classification. Oncotarget 2016; 7(47): 78140-51. |
| [32] | Wang J, Wu CJ, Bao ML, Zhang J, Wang XN, Zhang YD. Machine learning-based analysis of MR radiomics can help to improve the diagnostic performance of PI-RADS v2 in clinically relevant prostate cancer. Eur Radiol 2017; 27(10): 4082-90. |
| [33] | Kwak JT, Sankineni S, Xu S, et al. Correlation of magnetic resonance imaging with digital histopathology in prostate. Int J CARS 2016; 11(4): 657-66. |
| [34] | Fehr D, Veeraraghavan H, Wibmer A, et al. Automatic classification of prostate cancer Gleason scores from multiparametric magnetic resonance images. Proc Natl Acad Sci USA 2015; 112(46): E6265-73. |
| [35] | Zhao K, Wang C, Hu J, et al. Prostate cancer identification: quantitative analysis of T2-weighted MR images based on a back propagation artificial neural network model. Sci China Life Sci 2015; 58(7): 666-73. |
| [36] | Sun Y, Reynolds H, Wraith D, et al. Predicting prostate tumour location from multiparametric MRI using Gaussian kernel support vector machines: A preliminary study. Australas Phys Eng Sci Med 2017; 40(1): 39-49. |
| [37] | Tian Z, Liu L, Fei B. Deep convolutional neural network for prostate MR Segmentation. Int J CARS 2018; 13(11): 1687-96. |
| [38] | Guo Y, Gao Y, Shen D. Deformable MR prostate segmentation via deep feature learning and sparse patch matching IEEE Trans Med Imaging 2016; 35(4): 1077-89. |
| [39] | Guo Y, Gao Y, Shao Y, Price T, Oto A, Shen D. Deformable segmentation of 3D MR prostate images via distributed discriminative dictionary and ensemble learning Med Phys 2014; 41(7)072303 |
| [40] | To MNN, Vu DQ, Turkbey B, Choyke PL, Kwak JT. Deep dense multi-path neural network for prostate segmentation in magnetic resonance imaging. Int J CARS 2018; 13(11): 1687-96. |
| [41] | Kwak JT, Xu S, Wood BJ, et al. Automated prostate cancer detection using T2-weighted and high-b-value diffusion-weighted magnetic resonance imaging. Med Phys 2015; 42(5): 2368-78. |
| [42] | Haq NF, Kozlowski P, Jones EC, Chang SD, Goldenberg SL, Moradi M. A data-driven approach to prostate cancer detection from dynamic contrast enhanced MRI. Comput Med Imaging Graph 2015; 41: 37-45. |
| [43] | Marami B, Sirouspour S, Ghoul S, et al. Elastic registration of prostate MR images based on estimation of deformation states. Med Image Anal 2015; 21(1): 87-103. |
| [44] | Yan P, Cao Y, Yuan Y, Turkbey B, Choyke PL. Label image constrained multiatlas selection. IEEE Trans Cybern 2015; 45(6): 1158-68. |
| [45] | Habes M, Bahr J, Schiller T, et al. New technique for prostate volume assessment. World J Urol 2014; 32(6): 1559-64. |
| [46] | García Molina JF, Zheng L, Sertdemir M, Dinter DJ, Schönberg S, Rädle M. Incremental learning with SVM for multimodal classification of prostatic adenocarcinoma. PLoS One 2014; 9(4)e93600 |
| [47] | Rampun A, Zheng L, Malcolm P, Tiddeman B, Zwiggelaar R. Computer-aided detection of prostate cancer in T2-weighted MRI within the peripheral zone. Phys Med Biol 2016; 61(13): 4796-825. |
| [48] | Lemaître G, Martí R, Freixenet J, Vilanova JC, Walker PM, Meriaudeau F. Computer-Aided Detection and diagnosis for prostate cancer based on mono and multi-parametric MRI: A review. Comput Biol Med 2015; 60: 8-31. |
| [49] | Kwak JT, Hong CW, Pinto PA, et al. Is visual registration equivalent to semiautomated registration in prostate biopsy? BioMed Res Int 2015; 2015394742 |
| [50] | Ginsburg SB, Algohary A, Pahwa S, et al. Radiomic features for prostate cancer detection on MRI differ between the transition and peripheral zones: Preliminary findings from a multi-institutional study. J Magn Reson Imaging 2017; 46(1): 184-93. |
| [51] | Yang X, Liu C, Wang Z, et al. Co-trained convolutional neural networks for automated detection of prostate cancer in multi-parametric MRI. Med Image Anal 2017; 42: 212-27. |
| [52] | Yuan Y, Qin W, Buyyounouski M, et al. Prostate cancer classification with multiparametric MRI transfer learning model. Med Phys 2019; 46(2): 756-65. |
| [53] | Niaf E, Flamary R, Rouviére O, Lartisien C, Canu S. Kernel-based learning from both qualitative and quantitative labels: Application to prostate cancer diagnosis based on multiparametric MR imaging. IEEE trans image process 2014 March; 23(3): 979-91. |
| [54] | Gholisadeh N, Greer PB, Simpson J, et al. Characterisation of prostate cancer using diffusion tensor imaging: A new perspective. Eur j radiol 2019 jan; 110: 112-20. |
| [55] | Dikaios N, Giganti F, Sidhu HS, Johnston EW, Appayya MB, Simmons L, et al. Multi-parametric MRI zone-specific diagnostic model performance compared with experienced radiologists for detection of prostate cancer. Eur Radiol 2018; (Nov): 1-10. |
| [56] | Chatterjee A, Oto A. Future perspectives in multiparametric prostate MR imaging. MRI clin of N Amer 2019 Feb; 27(1): 117-30. |
| [57] | Patel N, Henry A, Scarsbrook A. The value of MR textural analysis in prostate cancer. Clin Radiol 2019; 74(11): 876-85. |
| [58] | Stanzione A, Cuocolo R, Cocozza S, et al. Detection of extraprostatic extension of cancer on biparametric MRI combining texture analysis and machine learning: preliminary results. Acad Radiol 2019; 26(10): 1338-44. |
| [59] | Wang B, Lei Y, Tian S, et al. Deeply supervised 3D fully convolution for automatic MRI prostate segmentation. Med Phys 2019. |
| [60] | Zhu Y, Wei R, Gao G, et al. Fully automatic segmentation on prostate MR images based on cascaded fully convolution network. J Magn Reson Imaging 2019; 49(4): 1149-56. |
| [61] | McGarry SD, Bukowy JD, Iczkowski KA, et al. Gleason probability maps: A radiomics tool for mapping prostate cancer likelihood in MRI space. Tomography 2019; 5(1): 127-34. |
| [62] | Rundo L, Militello C, Russo G, et al. Automated prostate gland segmentation based on an unsupervised fuzzy C-means clustering technique using multispectral T1w and T2w MR imaging. MDPI 2017; 8(49): 1-28. |
| [63] | Ishioka J, Matsuoka Y, Uehara S, et al. Computer-aided diagnosis of prostate cancer on magnetic resonance imaging using a convolutional neural network algorithm. BJU Int 2018; 122(3): 411-7. |